GIS6325 GIS Hazards and Vulnerability, semester project
- Category: Maps
- Place: Dept. of Geography, UF
- Date: Fall 2021
Portfolio submission description
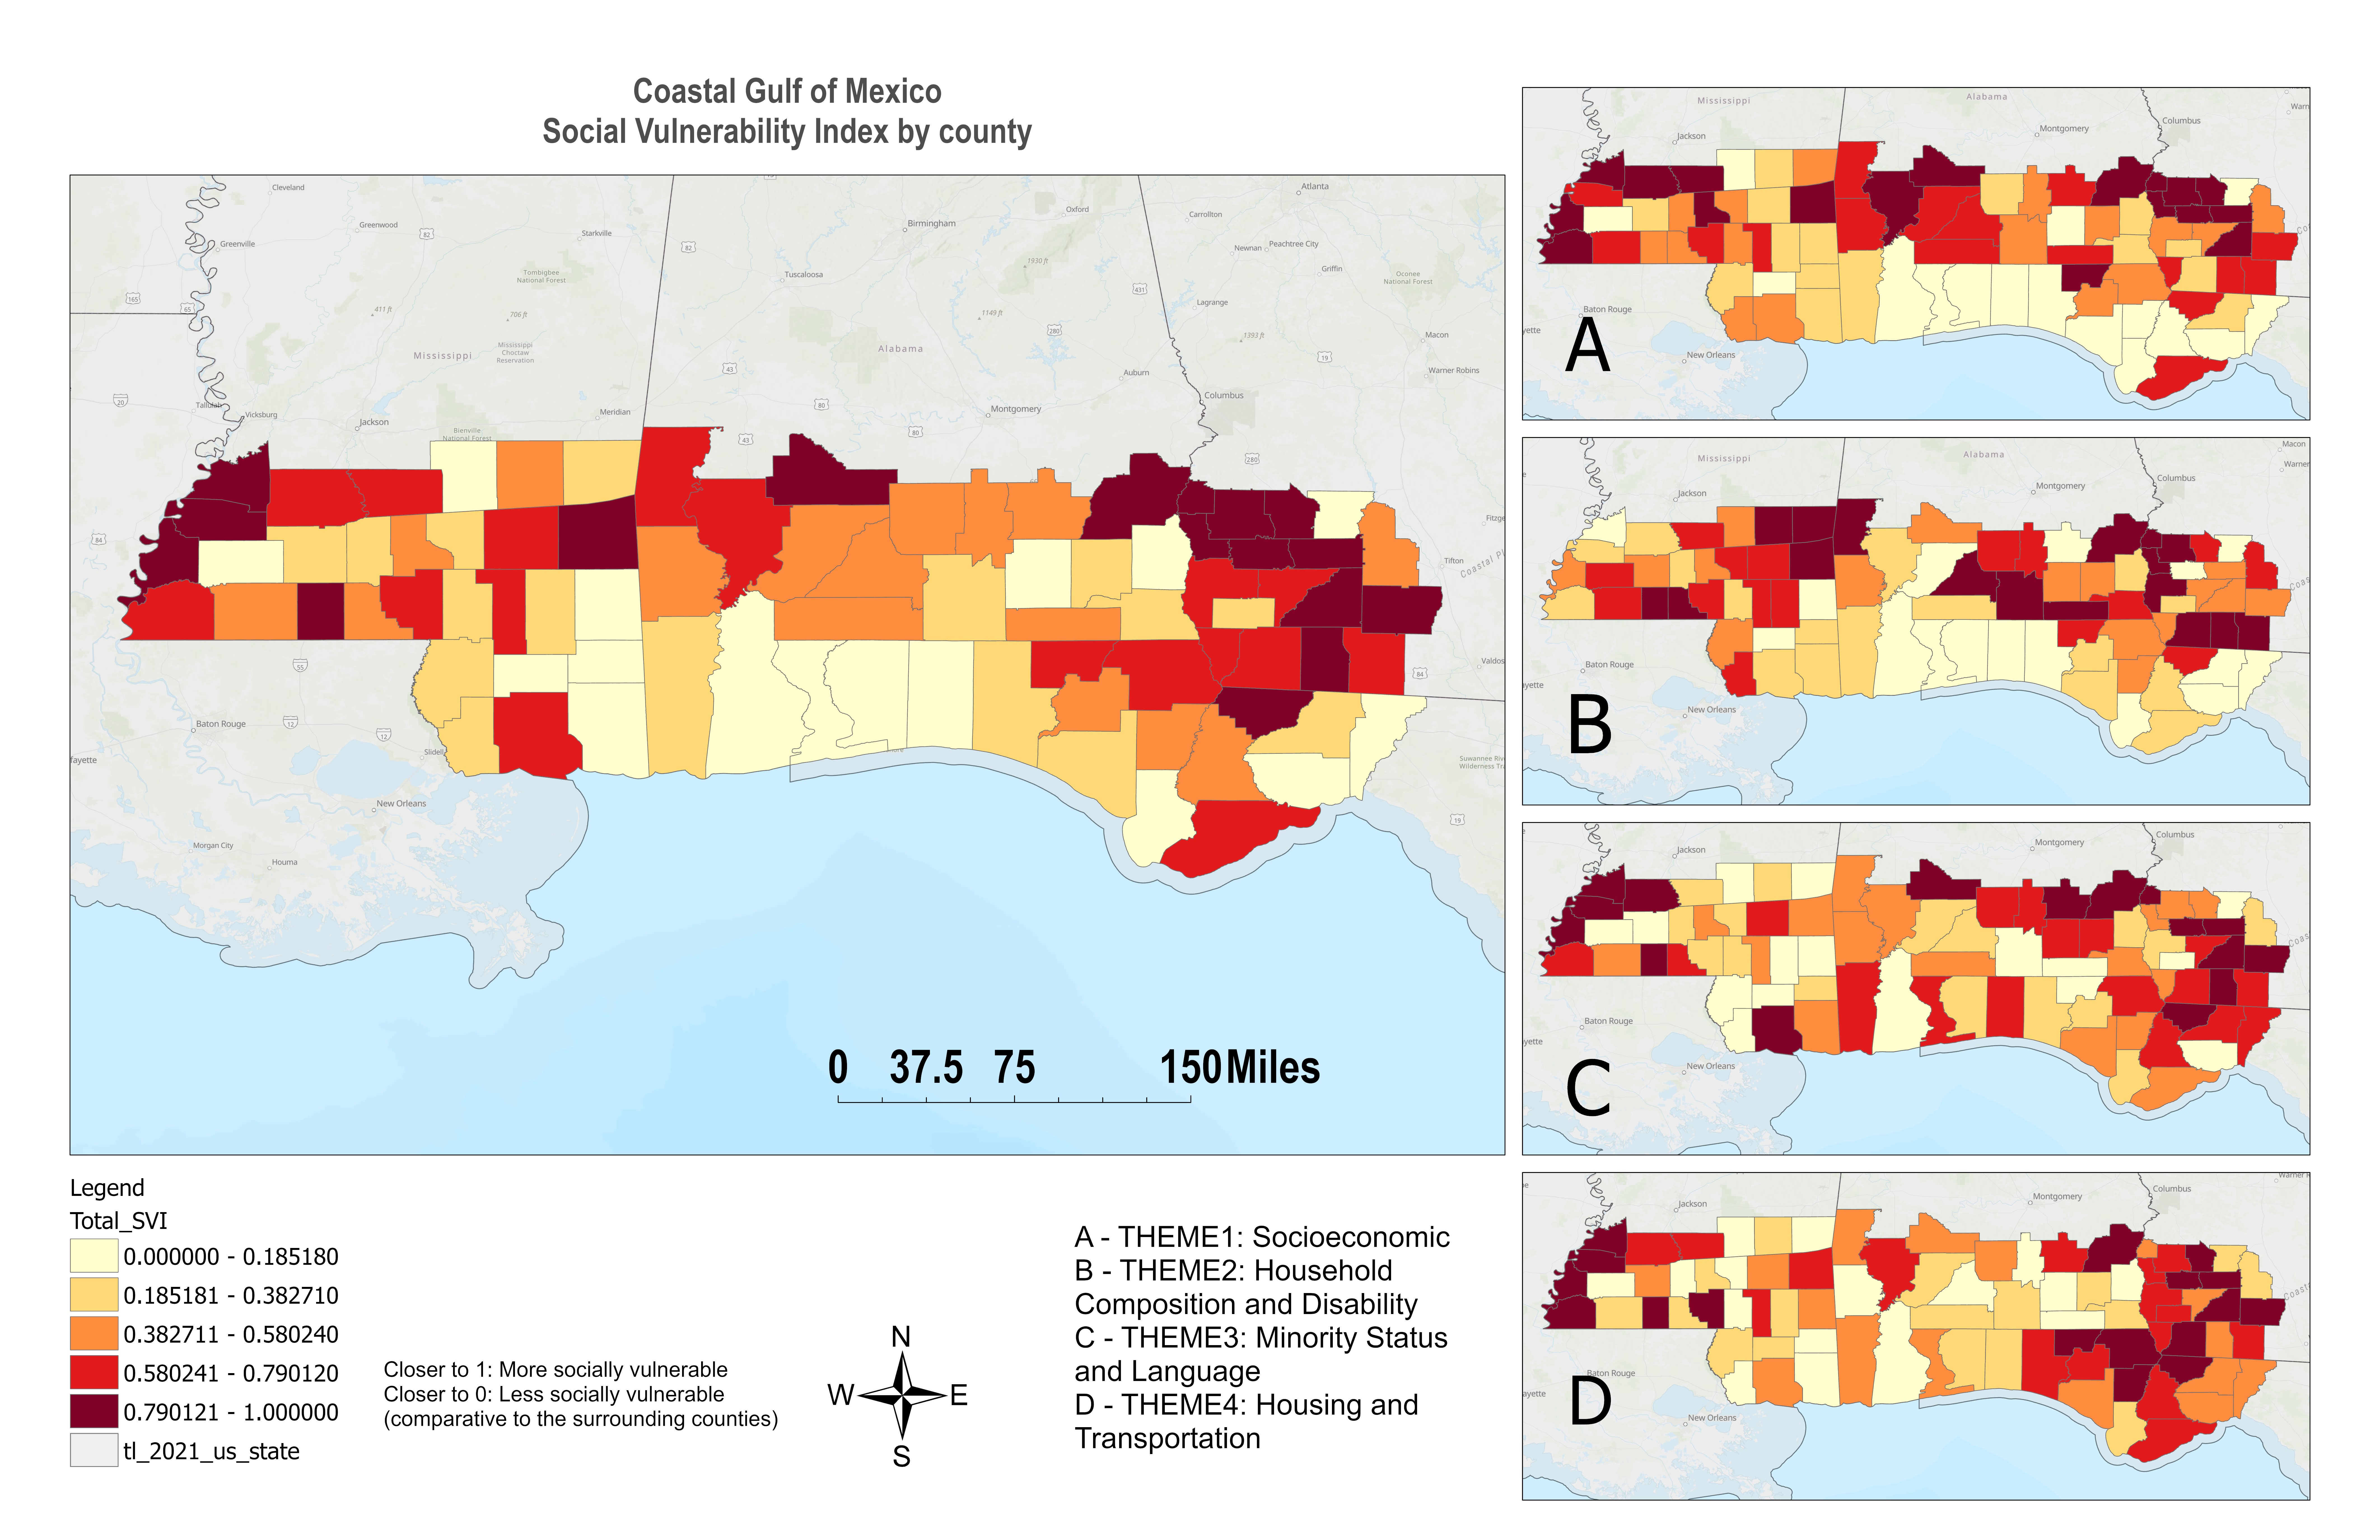
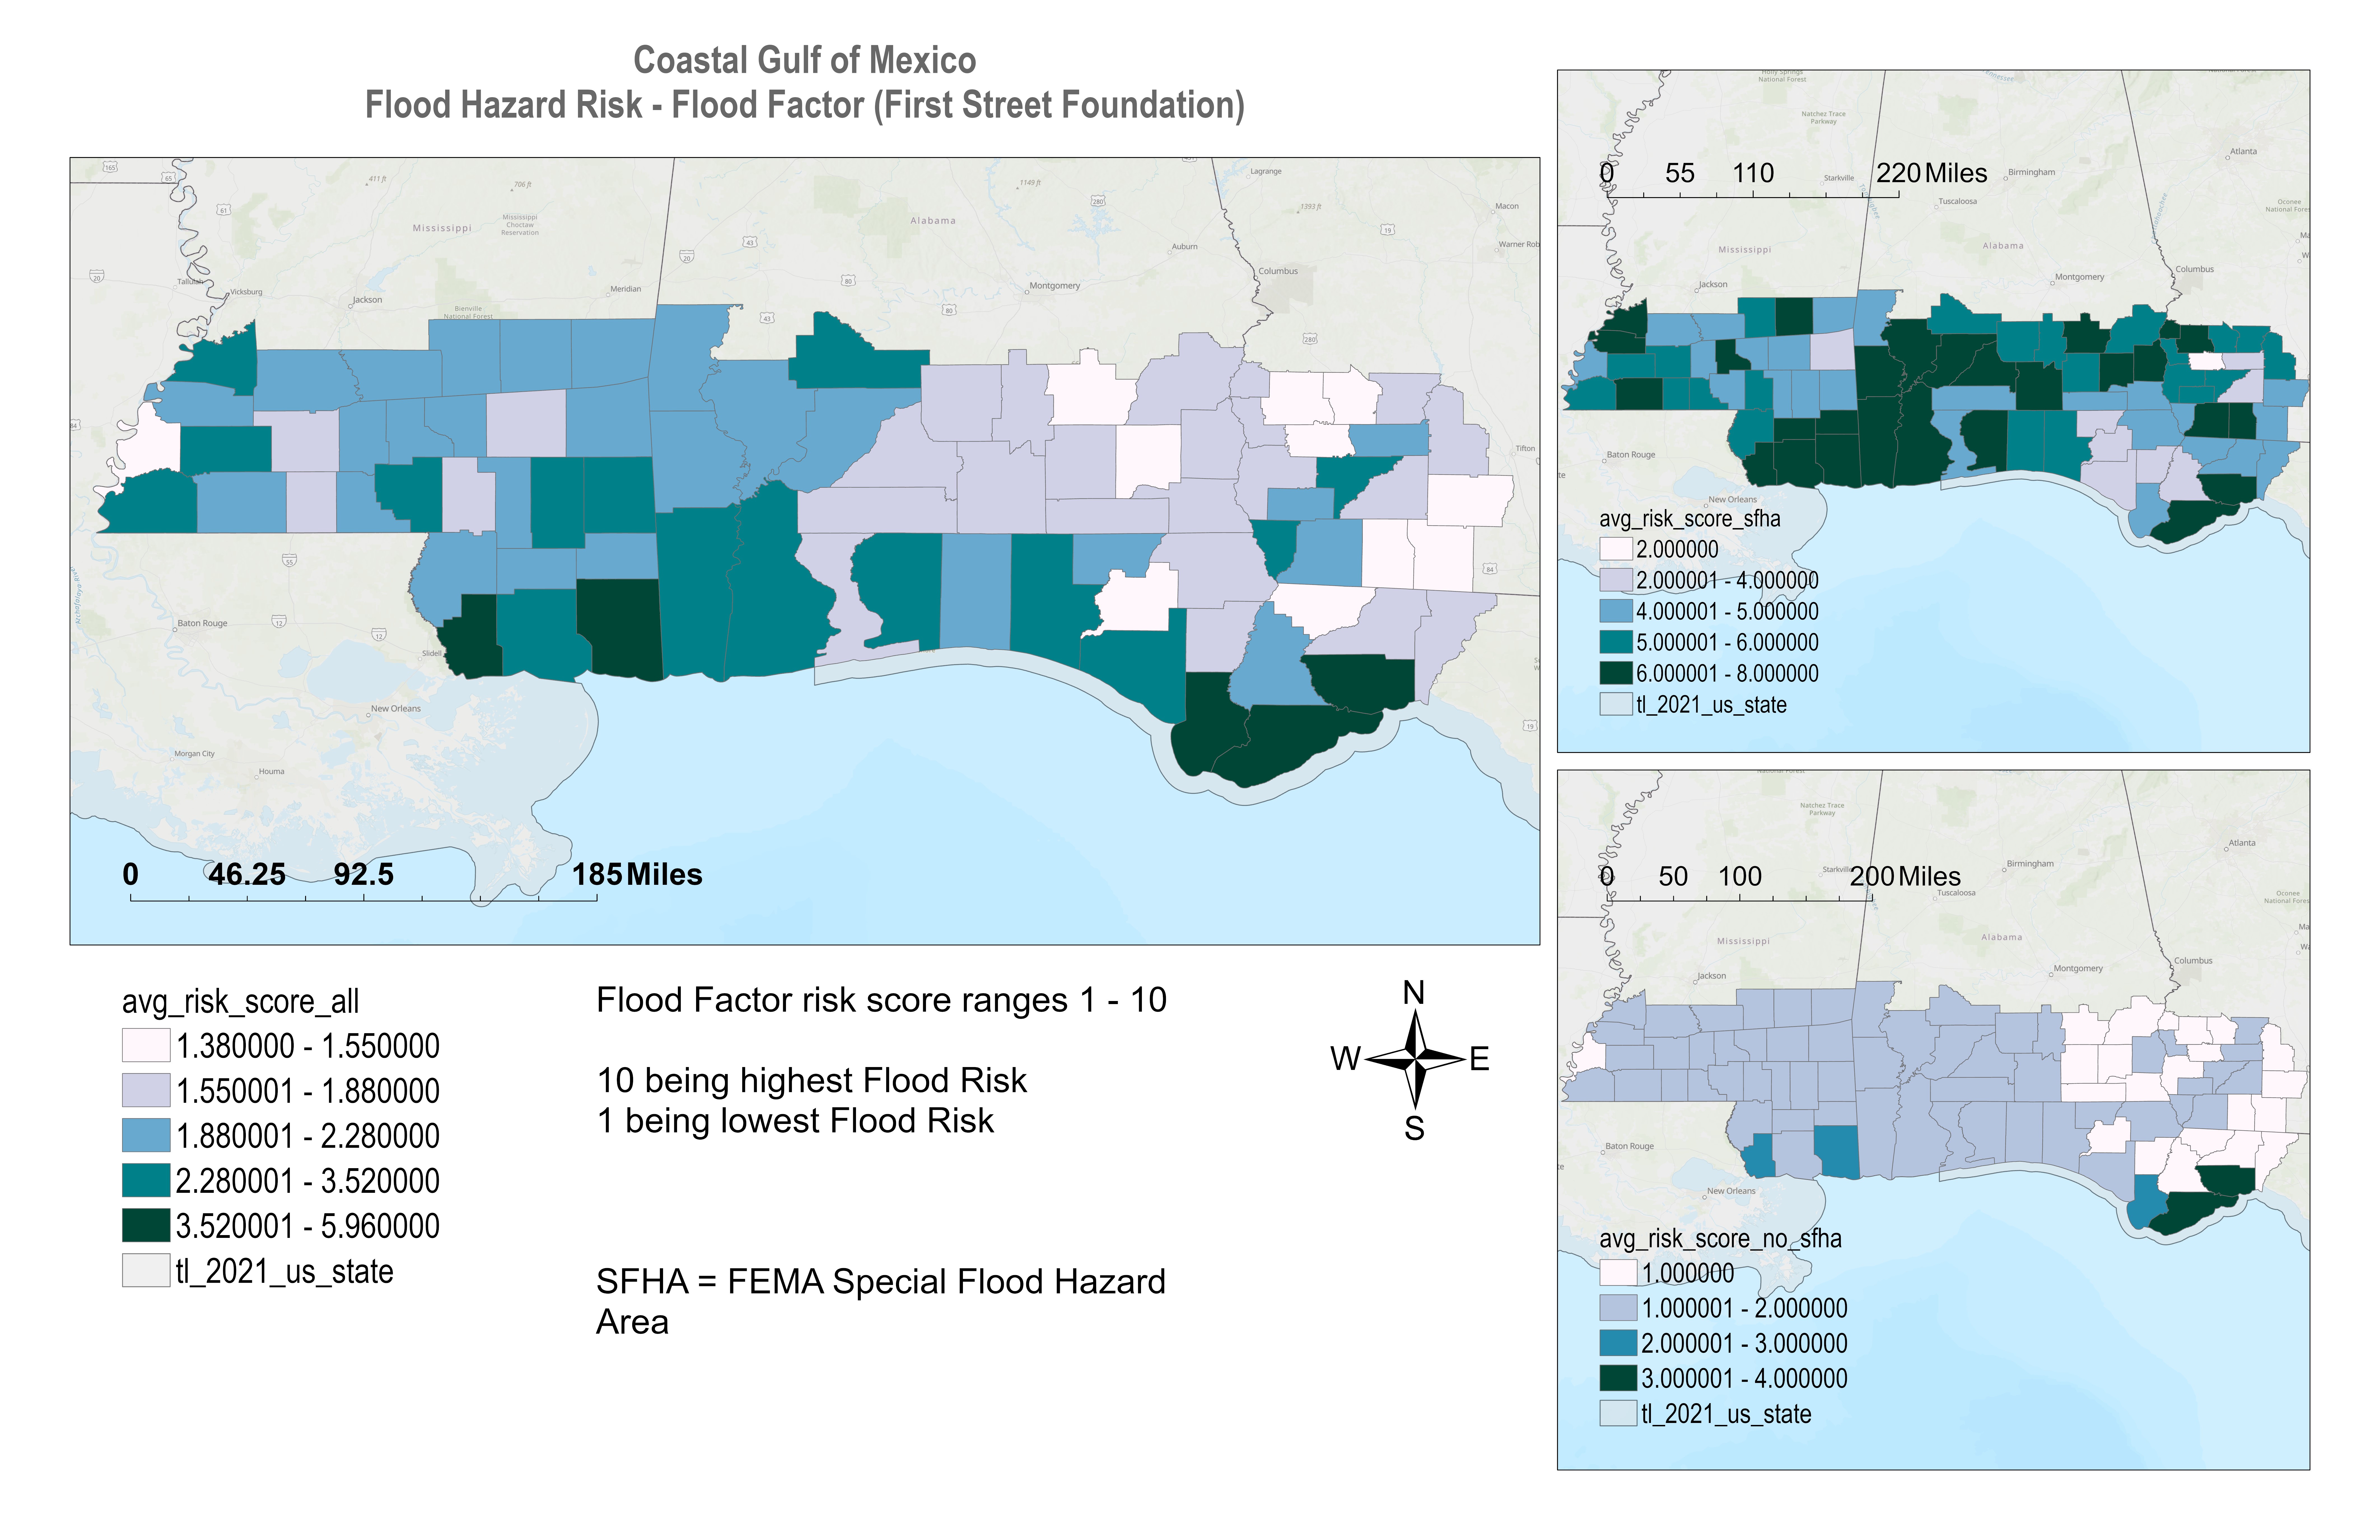
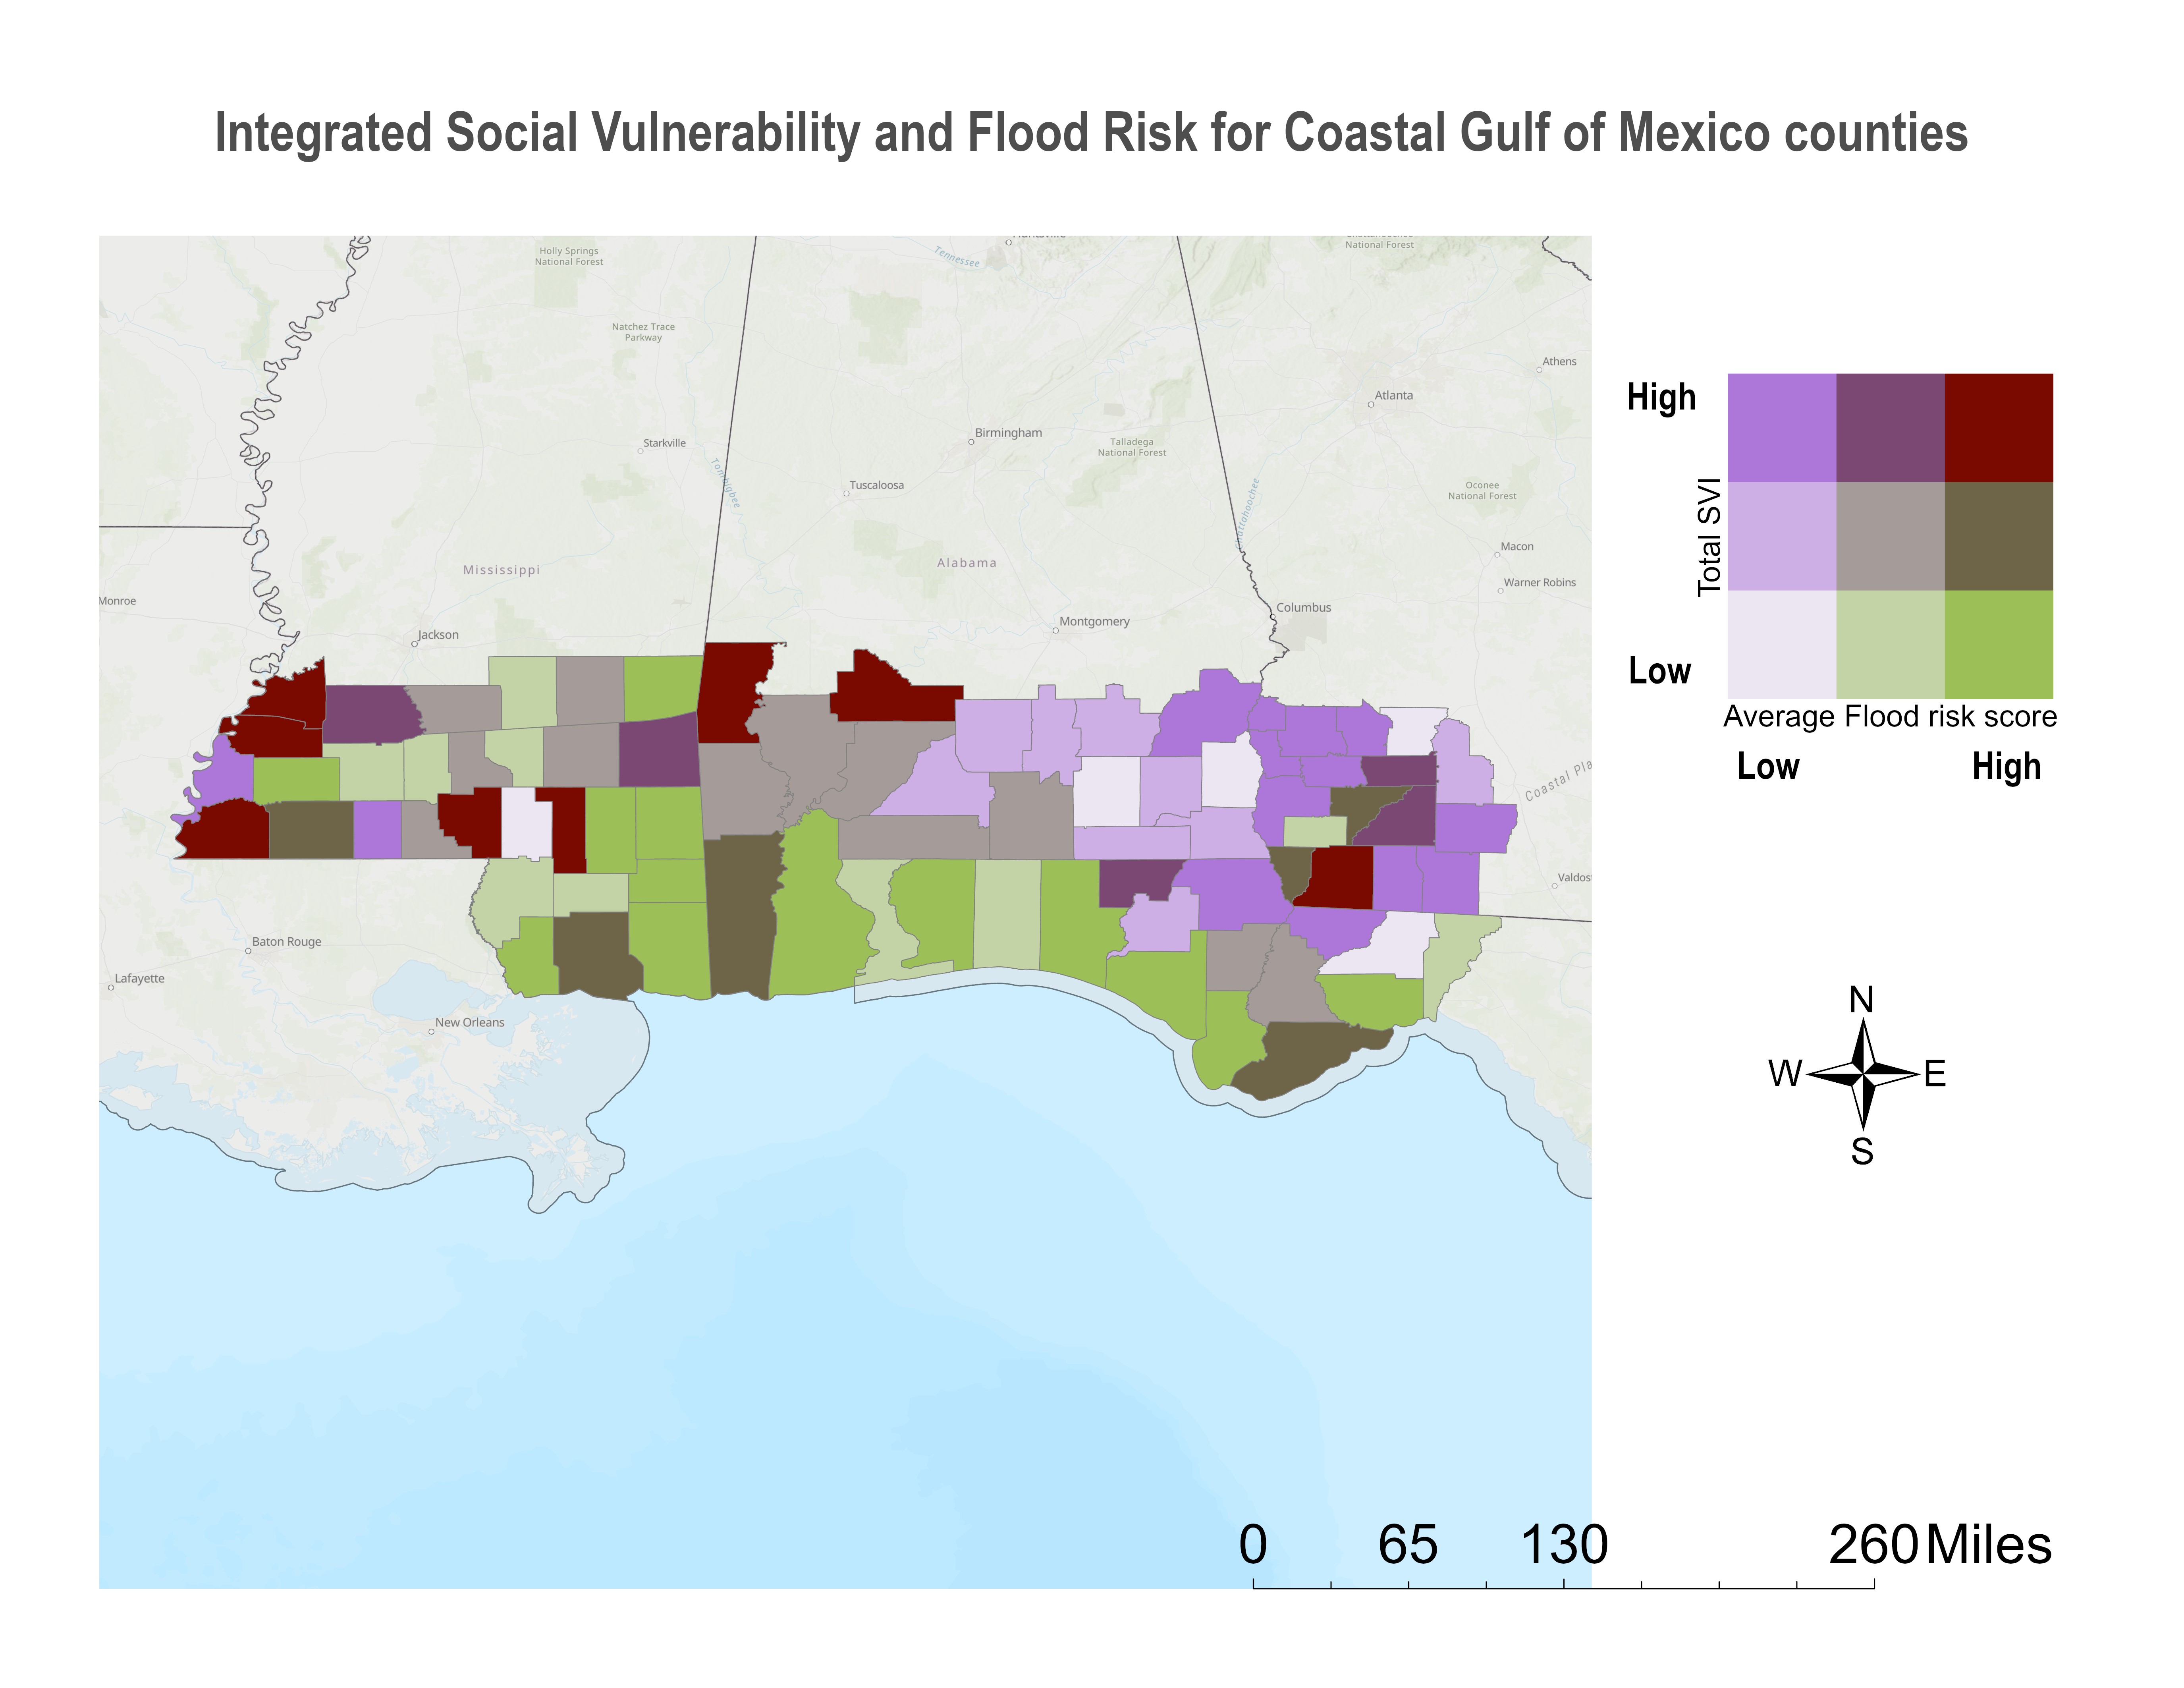
Analysis of Social Vulnerability and Flood Hazard in coastal Gulf of Mexico states at the county-level, United States. Patterns of total social vulnerability indicate that some of the slightly inland counties of southwest Georgia and neighboring Alabama, and southwest Mississippi, and pockets of southeast Mississippi and southwest Alabama, are socially vulnerable. Selected First Street Foundation variables mapped for the Gulf Counties study area. The highest average Flood factor scores with all areas taken into account, as indicated by the dark blue-green color, are in the southeast region of the study area in the eastern Florida panhandle, and the southernmost part of Mississippi. The Flood Factor in this category ranges from 3.52 to 5.96, highest average score Hancock County Mississippi, Franklin County Florida, and Wakulla County Florida respectively. Bivariate mapping of social vulnerability and flood hazard risk done as well, though together, the high and low scales are relative. The dark red, “high-high”, indicates areas of relatively high social vulnerability and high flood risk. Areas in purple, meaning that this is an area of relatively high social vulnerability and low flood risk. Areas of high flood risk and low social vulnerability comparatively, as shown in the green colors.


