
MET6565 Atmospheric Teleconnections, semester project
- Category: Maps & Data Viz
- Place: Dept. of Geography, UF
- Date: Spring 2022
Portfolio submission description
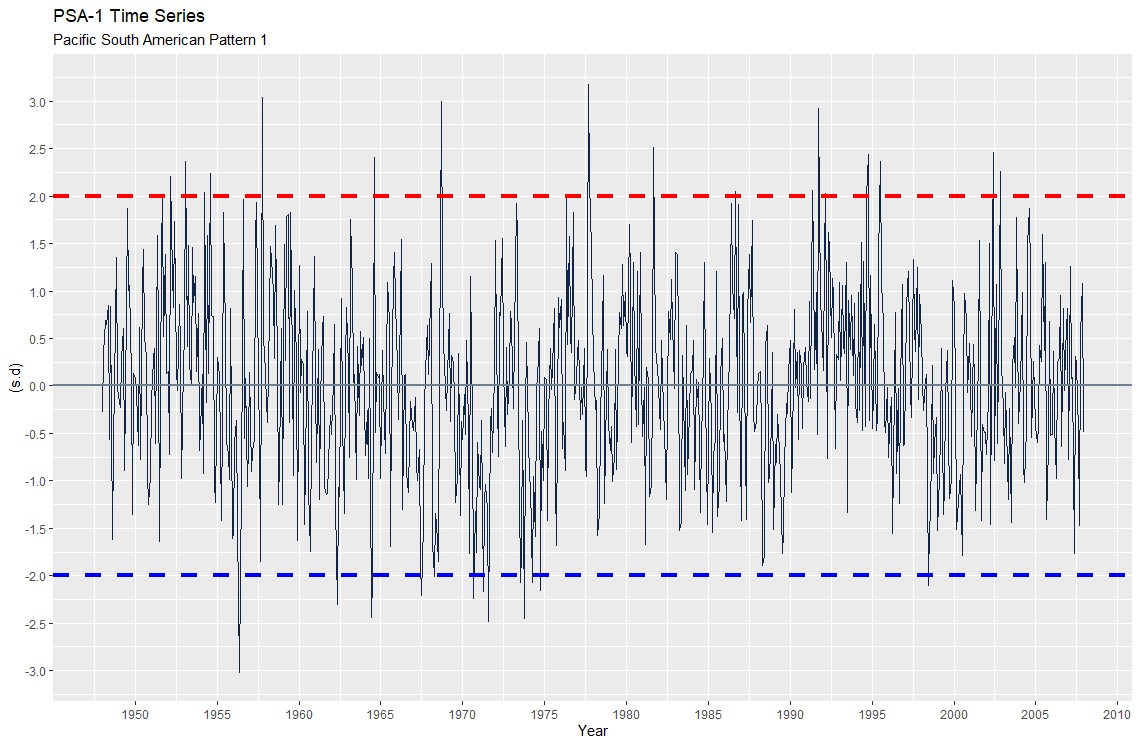
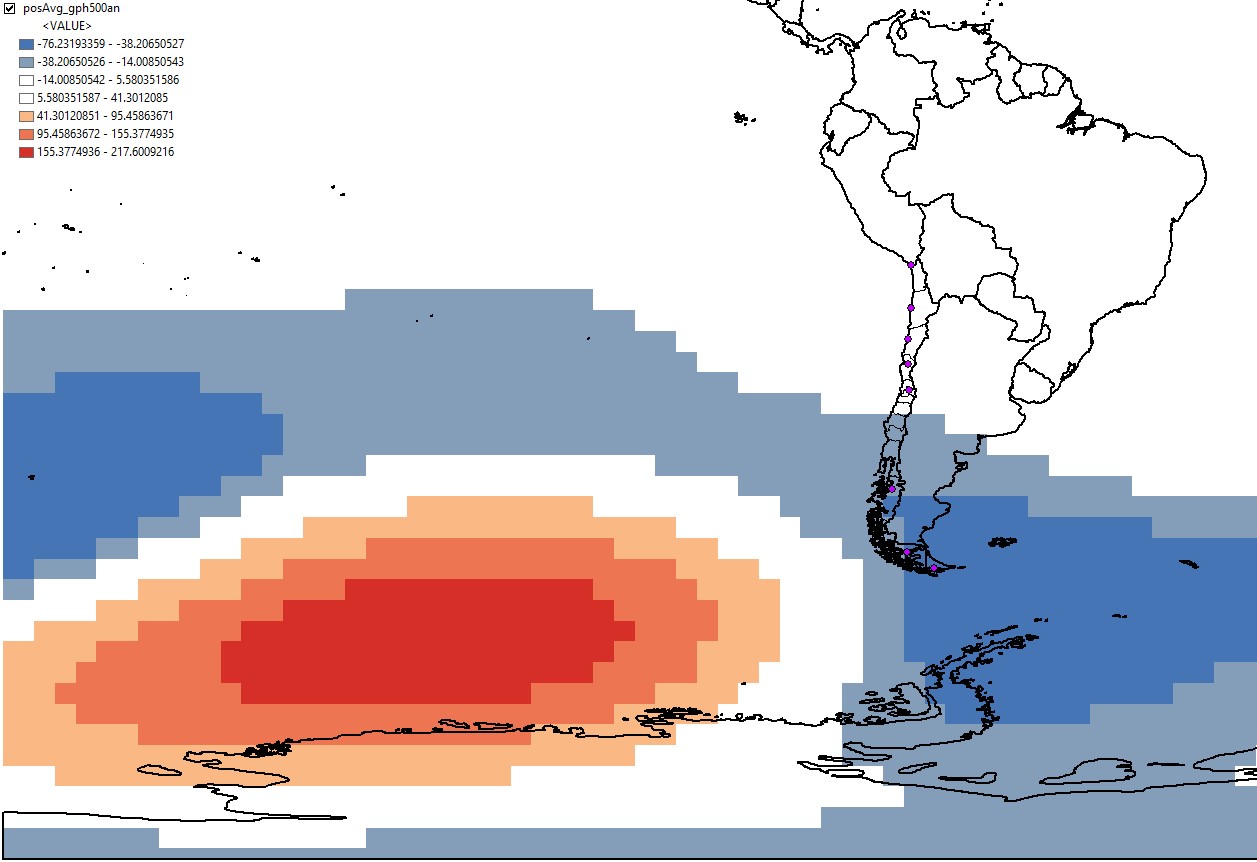
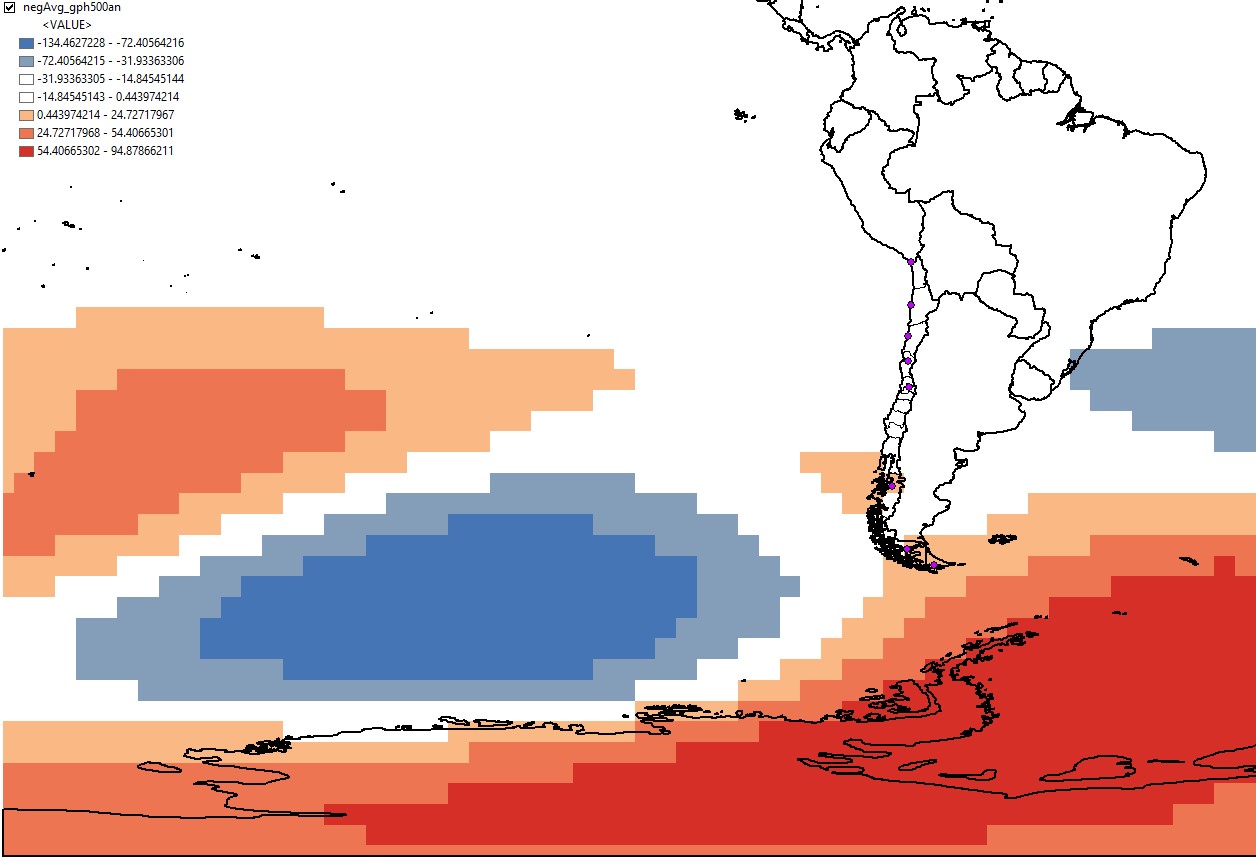
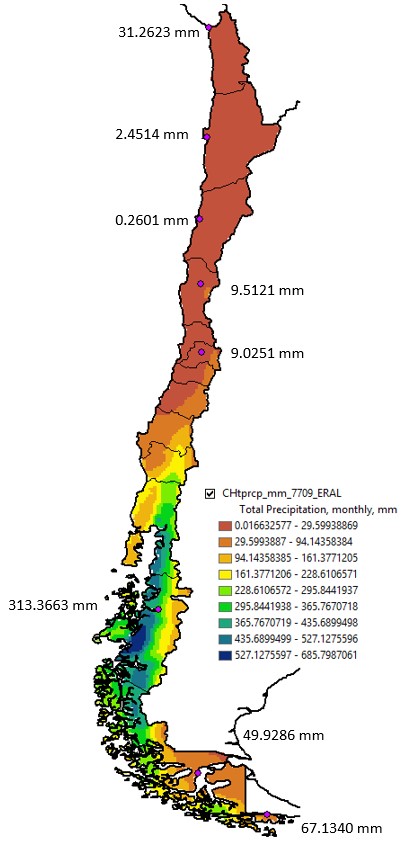
Exploratory Analysis of the Pacific-South American (PSA) Pattern and Precipitation in Chile. My goals with this project was to gain experience working with a relevant teleconnection to the South American region, as well as gain more experience working with gridded-datasets (and their file structure) in ArcMap and R Studio. The Pacific-South American pattern 1 (PSA-1) is defined as PC2 (principal component 2) of Z500 anomalies over the Southern Hemisphere, the time series graphs with red-dashed horizontal line is at +2 and the blue-dashed horizontal line is at -2, standard deviations away from the center index value. Average Z500 anomalies in strongly positive and then strongly negative years, are mapped. “Total Precipitation” in meters per day from ERA5-Land, converted to “Total Precipitation” in millimeters (monthly). The spatial patterns of total monthly precipitation (mm) in Chile from North to South is generally low-high-low, as shown by the warmer colors in the north and far-south, and cooler colors in the central-southern area, largely consistent for all month-years examined. This mapped raster is of November 1977, with stations for examining specific locations (data extraction to perform Mann-Whitney U statistical test on precipitation results between phases of PSA-1).