
MET6752 Spatial Analysis of Atmospheric Data using GIS, semester project
- Category: Maps & Data Viz
- Place: Dept. of Geography, UF
- Date: Fall 2021
Portfolio submission description
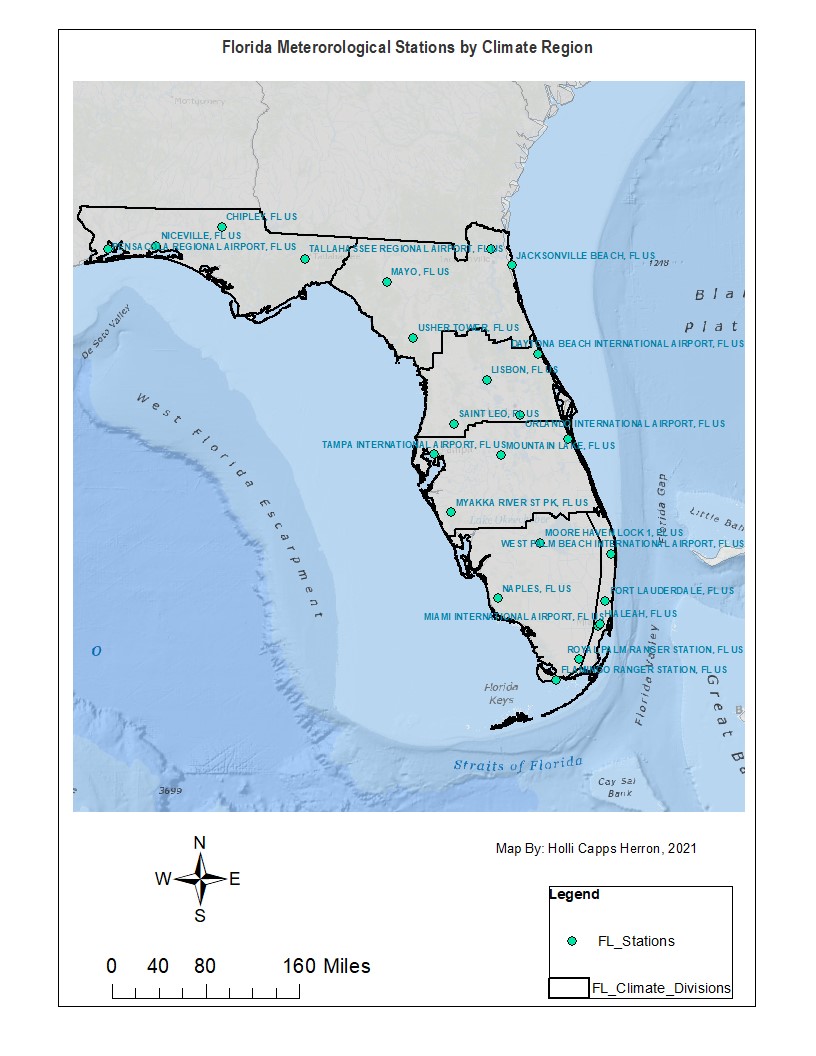
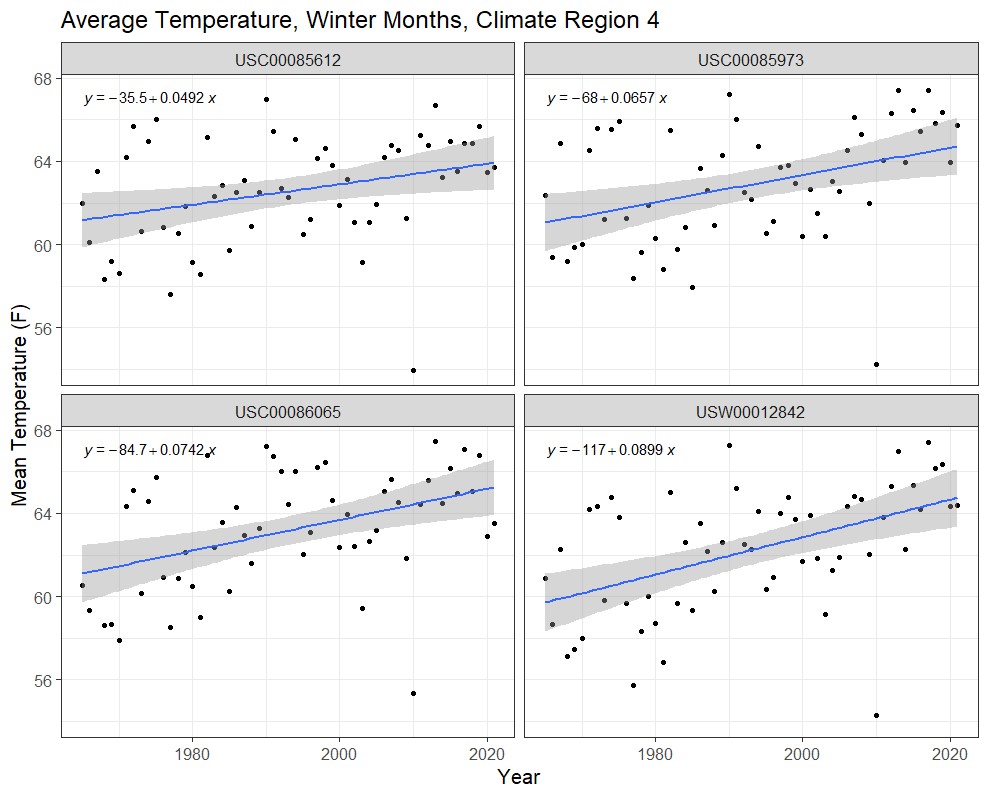
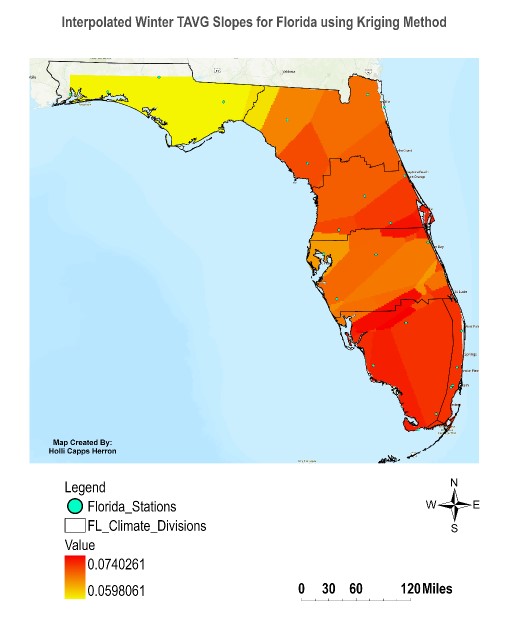
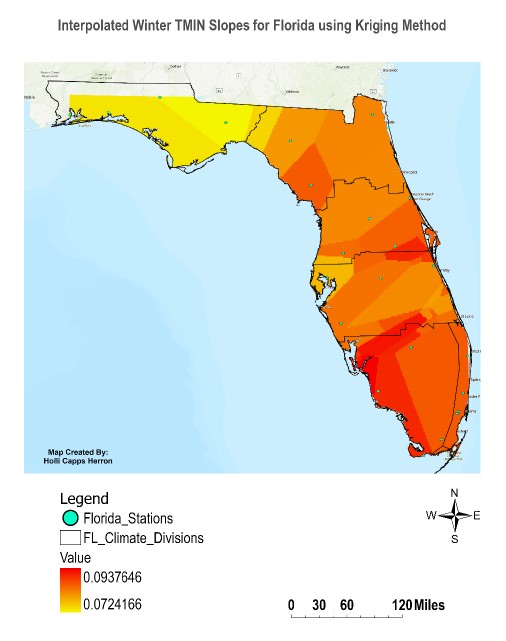
Temperature Time Series Trend Analysis in Florida Climate Regions from 1965-2021 and between seasons. Specifically looking at the winter season, as one of the indicators of climate change is the cold days and times (winter season, daily minimum temps, night temps, etc.) increasing or changing at faster rates compared to warmer or wetter seasons, and high temps. The winter season is defined as December, January and February. This research splits Florida into 6 Climate Regions by NOAA NCEI. Within each climate region, 4 meteorological stations long-term daily temp data was downloaded, for broad and even spatial coverage. All of the stations had data that was 95% complete or higher. The range of years vary between stations, but generally years are from 1965 to 2021. The data is daily temp in F, provided as average daily (TAVG), maximum (TMAX), and minimum (TMIN) temp. Once the winter season values are extracted, the daily average, maximum and minimum temps are averaged to provide an annual time series of the mean daily TAVG, TMAX, and TMIN. The R Package “Kendall” was used to perform the Mann-Kendall test on the annual mean daily temp variables to identify statistical trends. And the R Package “trend” was used to calculate the Sen’s Slope value, which provided the magnitude of trend change. The goal was to map Sen’s slope to get degree of increase/decrease F° trend per temp variable and season, using Kriging. This is done to attempt to get to get a full spatial coverage of the slope across Florida..