
GIS6325 GIS Hazards and Vulnerability, wildfire exposure assignment
- Category: Maps
- Place: Dept. of Geography, UF
- Date: Fall 2021
Portfolio submission description
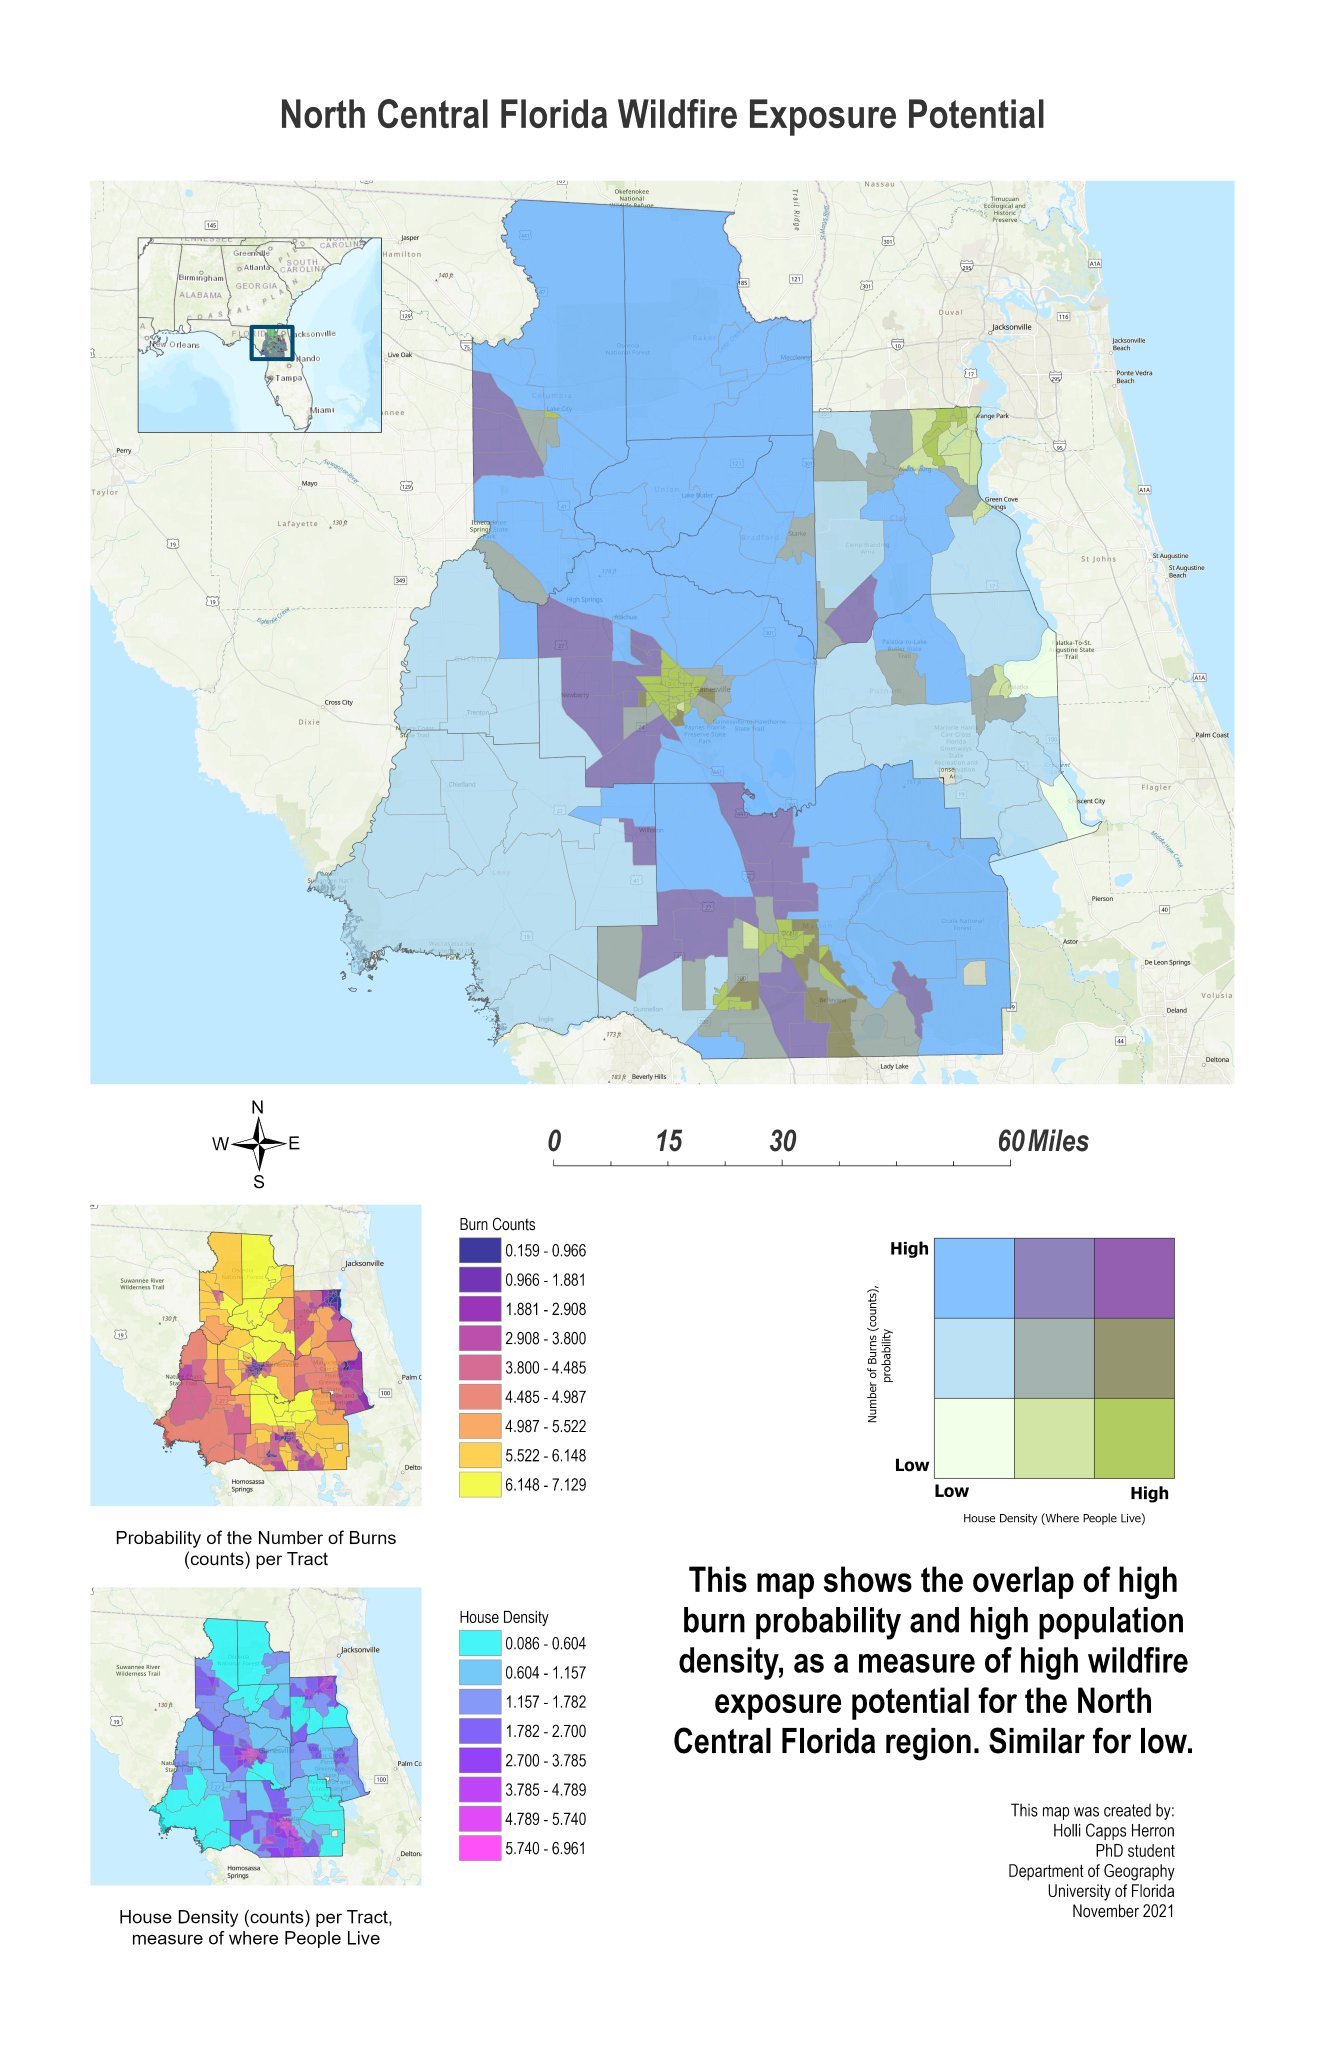
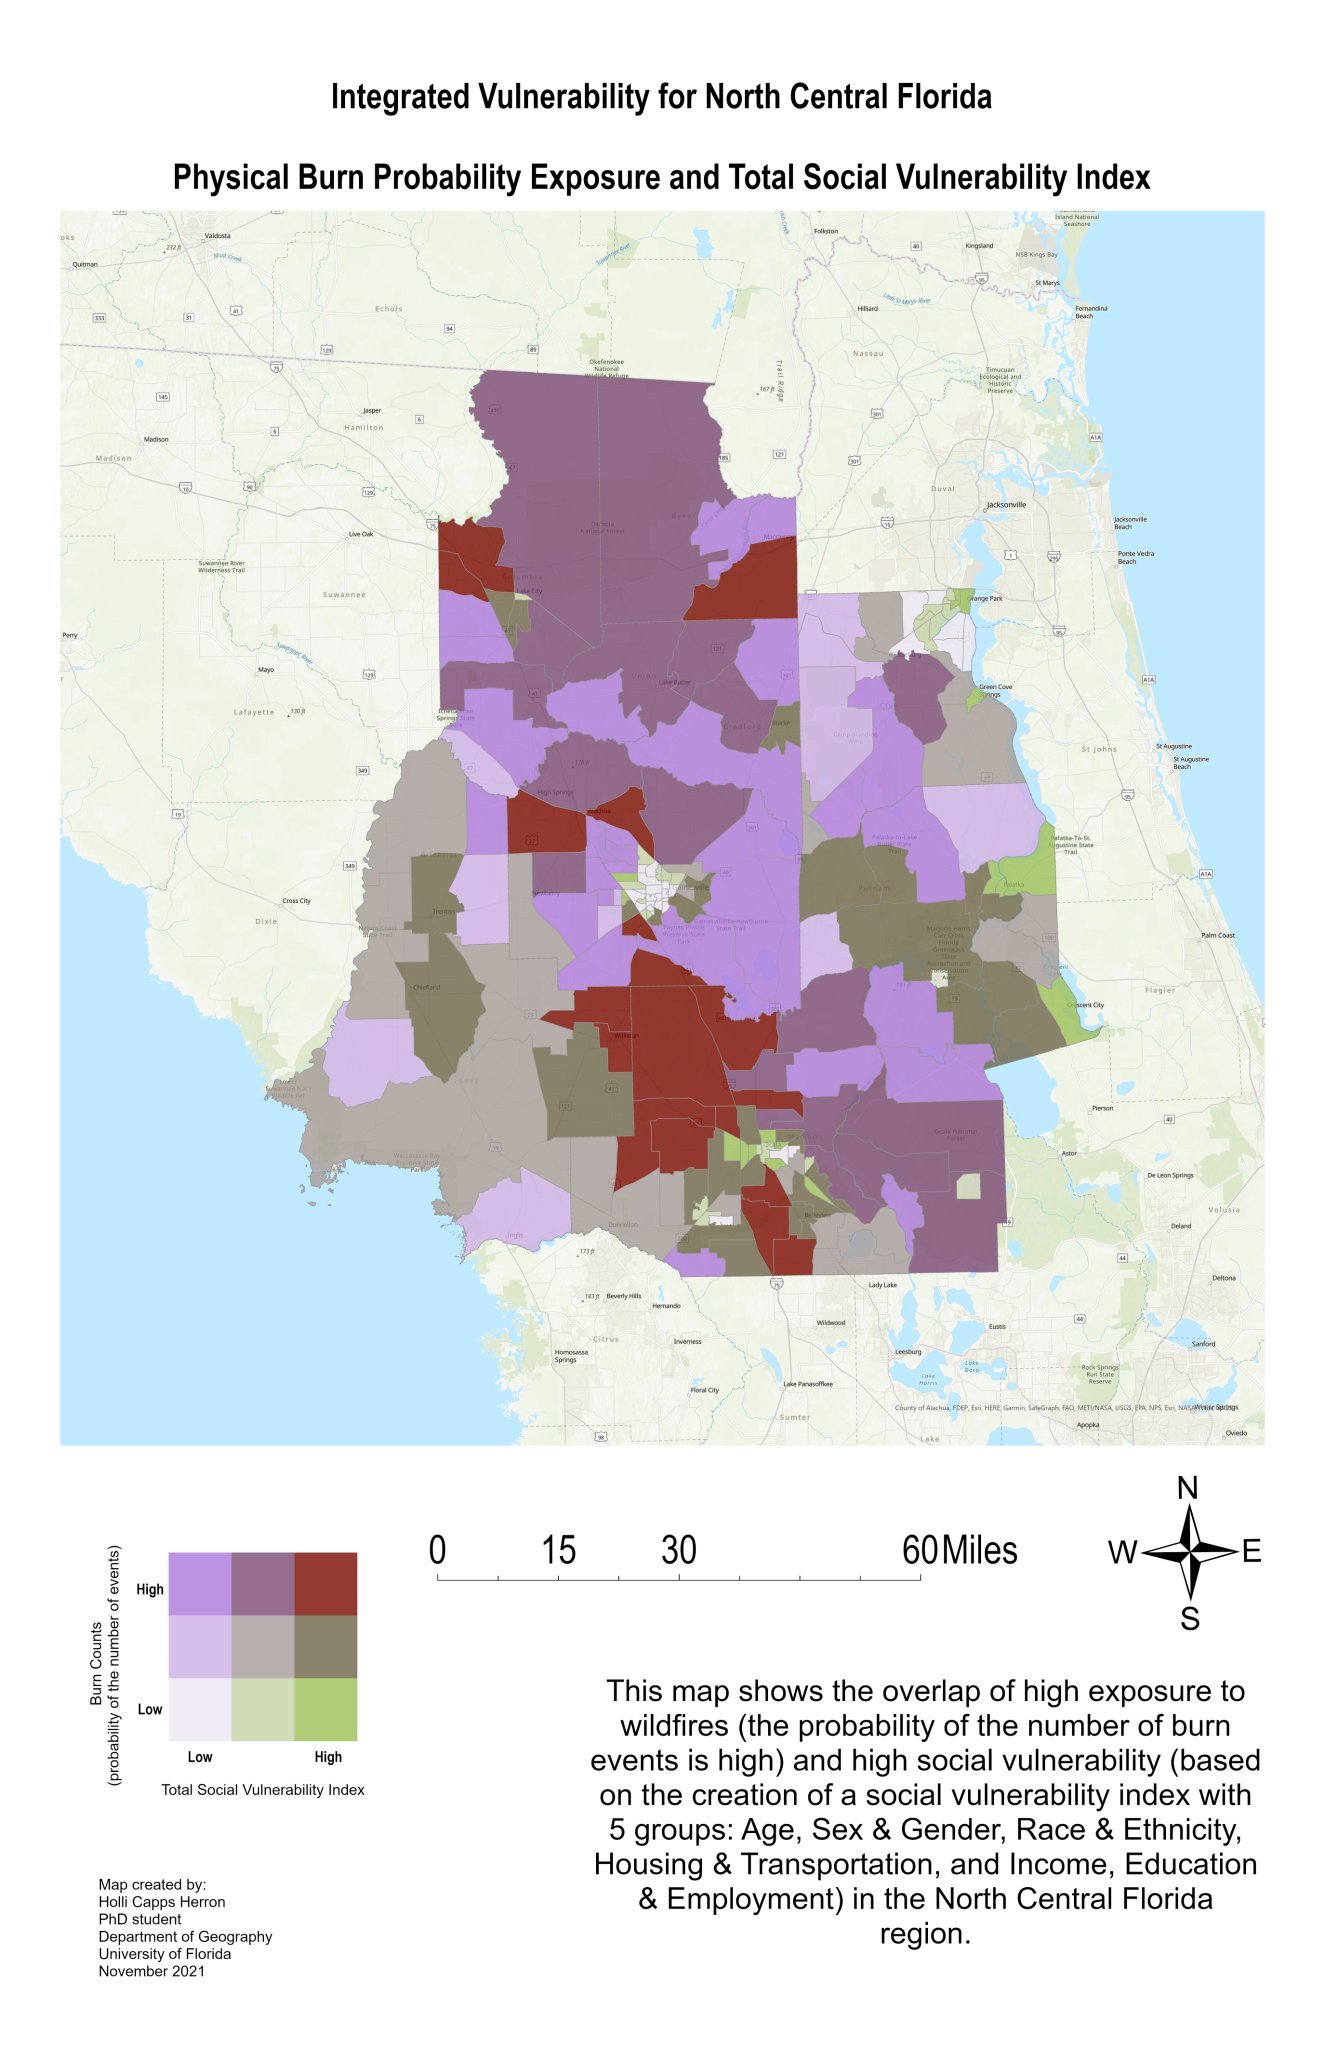
Integrated Physical and Social Vulnerability Analysis for Wildfires in Florida assignment. I summarized the probability of burns from the BurnProb_Polygon, and housing density/population from PeopleLive_Polygon at the tract level. The first step of this process was to use the Identity tool to see where burns or people overlapped with the tract boundaries. Areal weights were calculated and assigned based on the shape area of the grid codes and proportion of that to the total tract area. The weighted values were summarized by GEOID10, and then joined back to the “HVRI_SOVI” layer, because that was the layer with the tract-level information in it. Both the probability of burns and the Housing density were mapped individually, as well as together in a bivariate map to show areas of high (low) probable wildfire events with high (low) population. As the Social Vulnerability index takes population into account through percentages, I decided to keep it simple and from my physical hazard exposure, I kept only the probability of the number of burn events. And I mapped that as a bivariate map with the Total SVI that I created. From the results of this integrated vulnerability analysis, those areas with highest burn events (probability) as well as the highest social vulnerability can clearly be seen in the tracts filled in with dark red. In the middle part of this North Central Florida region, there is a general line north to south. These areas of “high-high” are outside of the National forests and major cities. Mainly around the Ocala National Forest and Ocala city, some areas outside of Gainesville, and around the Osceola National Forest and Lake City.